

3M stock recently jumped 23.0% in a day following strong earnings.
If you’re considering whether 3M Company (MMM) is a good stock to buy, you’ll want to evaluate the company’s safety and quality to see if it would make a suitable long-term investment.
While 3M is expected to grow over the next few years, it’s technically a mature company.
It’s all too common for mature companies to see lower sales, shrinking margins, decreased efficiency, and even growing debt levels because some mature businesses can’t keep up with an evolving market. This can all add up and wreak havoc on a company’s once-strong core business.
That’s why this article will fully analyze 3M’s financial safety and company quality so you can see if 3M Company is a good stock to buy today. We’ll cover 3M’s:
- Profitability
- Earnings Quality
- Debt
- Cash Conversion Efficiency
This article is a bit on the longer side, but if you’re interested in 3M, I recommend reading each section to better understand the company’s financial position.
Or, if you’re short on time, feel free to skip to the sections that interest you most.
How profitable is 3M?
Profitability is a key indicator of a company’s financial health and ability to generate shareholder returns.
Investors often seek out companies with strong profitability metrics because this indicates that a company can outcompete its competitors. More profitable companies can generally sell their products for more and produce their products and services for less.
Profit after Production Costs (Gross Margins)
Gross margin measures the percentage of revenue left over after a company pays its cost of goods sold (COGS), which is its materials and service costs directly related to creating and delivering its products.
3M’s cost of goods sold item includes costs related to raw materials, labor costs, and other manufacturing expenses.
Gross margin is important for investors to track because it helps to show whether customers are willing to pay a premium to what it costs the business to produce the products. By extension – a company with high gross margins probably has good products.
Additionally, investors can examine gross margin trends over time to determine whether the business has the pricing power to combat cost inflation and keep gross margins high.
3M has seen high gross margins of 44.8% in the last 12 months, while gross margins have decreased over the past 5 years from 49.2% in 2018 to 43.8% in the most recent fiscal year:

3M’s gross margins are OK, but not great. Ideally, we’d like to see companies with over 50% gross margins because that indicates that customers are willing to pay a premium to the company’s cost to fulfill the product or service.
Additionally, gross margins have been falling over the past 5 years, which isn’t good. This indicates that 3M might be competing in a competitive or cyclical industry.
Profitability After Corporate Costs (Operating Margins)
Operating margins measure what percentage of revenue remains as operating income after a company covers its operating expenses, and it’s one of the best measures of profitability for investors to compare companies.
One of 3M’s main operating expenses is its Selling, General & Administrative (SG&A) expenses, which include costs like marketing and advertising, salaries and wages for the sales and marketing staff, and other day-to-day expenses.
Operating margins exclude interest payments and taxes, making them the easiest way to compare profitability for different companies.
3M Company’s operating margins have noticeably fallen over the past 5 years, which is not good. Margins fell from 23.7% in 2018 to 18.0% for the most recent fiscal year:

Operating margins have declined over the past 5 years, which is bad because it means the company is becoming less profitable.
Naturally, you might be thinking:
Will they become more profitable in the future?
The good news is that analysts expect 3M to dramatically expand its operating margins over the next 5 years, reaching near 2018’s peak level:

Analysts expect 3M’s operating margins to increase at a compound annual growth rate of 3.7% from 19.5% in fiscal year 2023 to 23.5% in fiscal year 2028, while operating income is only expected to grow at a 0.8% CAGR over this same time period.
3 M should grow its operating margins over the next several years, which would help the company become more profitable.
3M’s Turbocharged Profit Engine (ROIC)
Return on invested capital (ROIC) is often considered the holy grail of profitability because it measures the total return that all investors are making on their investment in the company.
The formula takes the company’s annual profit and divides by the company’s total invested capital, or Enterprise Value (Market Cap + Debt – Cash).
To give you a visual example, let’s say a company has a 20% return on capital. That means for every $100 invested in the business, the value of that investment in the business would start to grow like this:
- Year 0: $100
- Year 1: $120
- Year 2: $144
- Year 3: $172.80
- Year 4: $207.36
- Year 5: $248.83
Returns on capital is one of the biggest creators of shareholder value!
Return on capital measures how businesses create value, and analyzing 3M’s return on capital helps investors see whether MMM Company is a good stock to buy.
3M’s return on capital has fallen in recent years from 31.2% in 2018 to 26.3% in the most recent fiscal year:

3M has been averaging over 20% returns on capital, which is good. We want to see companies generating 20% returns on capital or greater because that means the company is creating value from its investments.
3M Earnings Quality
Companies with high earnings quality are less likely to experience sharp profitability declines and are generally more transparent and trustworthy for investors.
This can lead to more stable stock prices and better long-term investment performance, so it’s an important measure of a company’s financial health. Analyzing 3M’s financial health is a key part of analyzing whether 3M is a good stock to buy.
How real are 3M’s earnings?
We like to see a company’s Cash from Operations exceed its Adjusted Net Income + Depreciation and Amortization because this metric indicates whether the company has a good income-to-cash conversion.
It also shows how “real” the earnings are because sometimes companies will report earnings massively inflated from the actual cash the business receives.
You can see that 3M Company’s cash from operations (blue) is generally greater than or equal to the company’s adjusted net income (black) + depreciation & amortization (green), which shows strong cash flow efficiency:

Note: 3M reported negative net income in 2023 due to a massive $14.5 billion legal settlement. This is an irregular expense, and the company is still expected to report positive net income going forward.
3M generally has higher cash from operations than its net income plus D&A. This basically means that the company has legitimate cash flow to back its earnings, so the business has a good income-to-cash conversion.
What’s 3M’s free cash flow growth rate?
A company with strong free cash flow generation can generate surplus cash, invest in growth opportunities, pay dividends, and even buy back shares.
Free cash flow refers to a company’s Operating Cash Flow minus Capital Expenditures, which measures the total cash the business generates and subtracts necessary investments in property, plant, and equipment.
FCF is one of the most popular metrics for investors to track because consistent free cash flow growth is crucial for strong companies. Even though 3M’s free cash flow has risen and fallen over time, FCF has grown from $4.86 billion in 2018 to $5.07 billion in 2023:
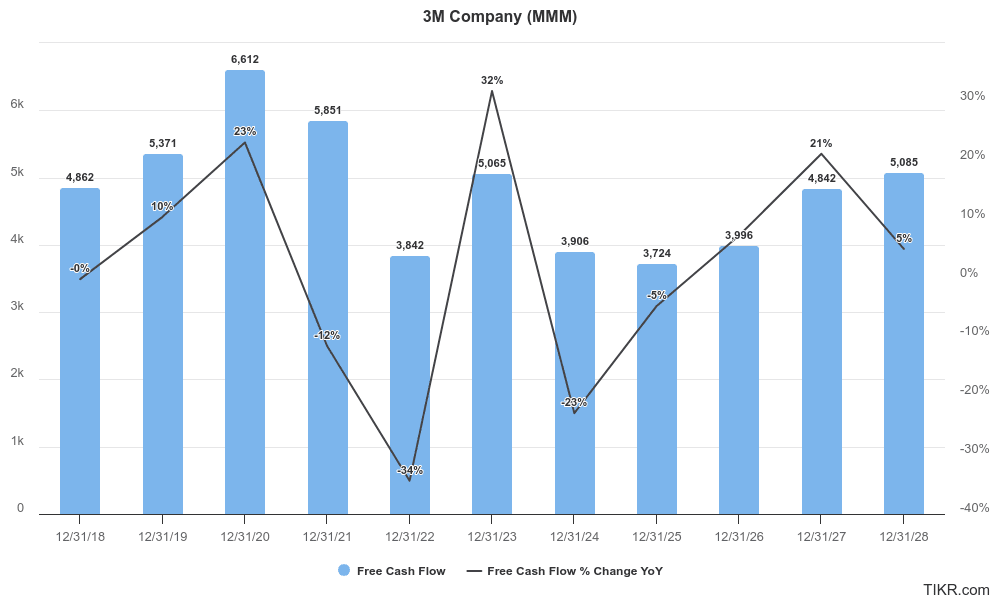
Analysts expect 3M Company to be able to grow its free cash flow at a 10.6% CAGR over the next 5 years. This is good because consistent free cash flow growth is one of the primary drivers of creating shareholder value within a business for investors.
How safe is 3M’s debt?
Debt ratios are crucial for assessing a company’s financial risk.
High levels of debt can indicate potential financial instability, especially if the company faces a downturn or rising interest rates. Conversely, low debt levels may suggest that a company is stronger and can withstand economic downturns.
Assessing debt ratios for more mature businesses like 3M is especially important because it helps ensure the company’s strong cash flows and low risks of default or financial insolvency.
Net Debt/EBITDA
This ratio measures a company’s ability to pay off its net debt (total debt minus cash) with its earnings before interest, taxes, depreciation, and amortization (EBITDA). It’s simply net debt divided by EBITDA.
This ratio is a key indicator of a company’s financial health and leverage. It’s better to see a low Net Debt/EBITDA ratio because this suggests that a company is less reliant on debt to finance its operations.
Over the past 10 years, 3M’s Net Debt/EBITDA ratio has generally fluctuated somewhere between 1x and 1.5x, which is healthy and reasonable:

Currently, 3M has a fair Net Debt/EBITDA of about 1.23x, which is lower than the previous 3 years and shows that debt is trending in the right direction.
Can MMM easily cover its interest payments?
The Interest Coverage ratio measures how easily a company can pay off the interest it has on its outstanding debt. It’s calculated by dividing earnings before interest and taxes (EBIT) by the company’s interest expense.
It’s better to see a higher interest coverage ratio because this indicates that the company generates enough earnings to cover its interest payments comfortably.
Meanwhile, a low interest coverage ratio can be a red flag because it indicates that the company might have difficulties meeting its interest obligations.
Over the past 10 years, 3M has seen its interest coverage ratio fall pretty dramatically, landing at just 6.25x in the last 12 months:

We like to see companies with interest coverage ratios anywhere over 3x, so 3M’s interest coverage ratio is still strong, despite falling so dramatically over the past decade.
3M’s debt load has more than doubled in the past 10 years, so naturally, the company won’t be able to cover the interest on its debt so easily. Although this ratio has fallen, investors really have nothing to worry about regarding 3M Company’s ability to pay the interest on its debt.
3M’s strong financial stability is a positive indicator that it could be a good stock to buy.
How well-tuned is 3M’s business?
One easy way to measure whether a company is becoming more efficient over time is to examine its cash conversion cycle.
The Cash Conversion Cycle (CCC) measures how quickly the company can receive cash after creating its products and how slowly it pays out cash for its expenses. It is calculated by combining three key components:
- Days Sales Outstanding (DSO): Measures the average number of days a company takes to collect cash after selling something.
- Days Inventory Outstanding (DIO): Measures the average number of days it takes a company to sell its inventory.
- Days Payable Outstanding (DPO): Measures the average number of days a company takes to pay its suppliers.
The formula for CCC is:
CCC = DSO + DIO − DPO
The lower the Cash Conversion Cycle – the better.
The Cash Conversion Cycle is important for manufacturing companies that hold physical inventory, like 3M.
Companies with low CCCs get paid quickly, which means they hold as little inventory as possible and receive cash from sales quickly.
Additionally, companies with low CCCs tend to have agreements with their suppliers to pay later. All in all, a company’s cash conversion cycle helps determine whether it can collect cash fast and pay cash out slowly.
3M Company’s cash conversion cycle has improved slightly in the past 10 years from 92 days to just 87 days. This is kind of good.
The company also improved its cash collection following Covid, with its CCC dropping from 94 days in fiscal year 2020 to 87 days in fiscal year 2023:

These improvements were primarily driven by 3M’s ability to delay its payments to suppliers, which improved its cash flow efficiency.
How quickly do customers pay 3M?
Days Sales Outstanding (DSO) measures the average number of days it takes a company to collect payment after a sale.
It is calculated by dividing accounts receivable by total sales, multiplied by the number of days in the period (typically 365 for 365 days in a year).
Investors prefer to see companies with a lower DSO, which means that the company collects payments quickly, improving cash flow and reducing the risk of bad debts.
Conversely, companies with consistently high DSO might have issues with cash flow management or potential problems with customer creditworthiness.
Over the past 3 years, 3M has been able to reduce its DSO from 54 to 52, indicating that the company was a tiny bit more efficient in turning its accounts receivable into cash quicker:

How quickly can 3M sell its inventory?
Days Inventory Outstanding (DIO) is a key measure of inventory management efficiency because it measures the average number of days it takes a company to sell its inventory.
It is calculated by dividing inventory by cost of goods sold (COGS) and multiplying by the number of days in the period (typically 365).
A lower DIO is good because it indicates that a company can sell its inventory quickly, which can reduce storage costs and minimize the risk of inventory going obsolete.
Efficient inventory management can lead to better cash flow and higher profitability, which makes DIO an important metric for investors to be aware of.
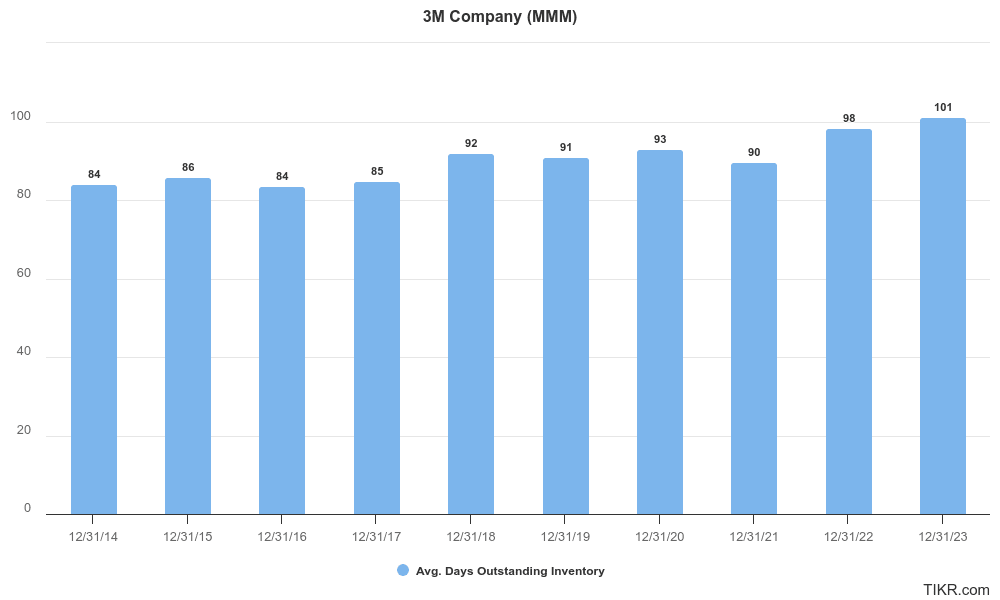
Over the past 3 years, 3M increased its DIO from 93 days to 101 days, which is not good because it means that the company became a little less efficient:
How slowly can 3M pay its suppliers?
Days Payable Outstanding (DPO) measures the average time it takes a company to pay its suppliers after receiving inventory or services.
It is calculated by dividing accounts payable by the cost of goods sold (COGS) and multiplying by the number of days in the period (usually 365).
A higher DPO is better because that means the company takes longer to pay its suppliers, which frees up cash that the company can use.
Over the past 3 years, 3M has seen big improvements increasing the number of days it takes to pay its suppliers from 53 days in 2020 to 66 days in 2023. This is good:

This was the primary driver behind the company becoming more efficient with its cash collection.
Final Thoughts:
3M is a fairly quality business. The company has averaged over 20% returns on capital, and analysts expect margins to increase in future years after gross and operating margins have fallen precipitously in the past 5 years.
MMM also has strong financial safety with earnings adequately backed by cash flows, good debt ratios, and strong cash conversion efficiency with a cash conversion cycle that’s improved slightly in recent years.
3M Company is a high-quality business that’s financially safe to invest in, which means it could be a good stock to buy at the right price.
Check out 3M’s Analyst Estimates to get a full look at where Wall Street analysts think the company is going and 3M’s Valuation to see if the stock is appropriately priced.
3M Company (MMM) Stock FAQs:
Is 3M a safe stock?
3M (MMM) appears to be a safe stock because it has strong financial safety, with a healthy Net Debt/EBITDA ratio of 1.23x and an excellent Interest Coverage ratio of 6.25x. The company has also been increasing its cash efficiency, decreasing its cash conversion cycle in the past 3 years from 94 days to 87 days.
Is 3M a good stock to buy right now?
3M appears to be a quality business with strong financial safety. The company saw a 31.3% ROIC in the past 12 months, and analysts expect operating margins to improve in the future. It’s important to evaluate whether 3M aligns with your long-term investment goals and risk tolerance.
Why did 3M stock rise?
3M’s share price saw a huge one-day jump in July 2024 when the company’s reported earnings beat analysts’ expectations for revenue, operating profit, and earnings per share (EPS). The company also increased full-year earnings guidance, which helped to increase investors’ confidence. Under new CEO William Brown, the company has refocused on growth by settling two large class-action lawsuits, spinning off its Solventum healthcare unit, and outlining plans to drive growth through innovation and capital deployment. Additionally, structural reorganization efforts, including streamlining operations and optimizing manufacturing roles, and solid momentum in the Transportation and Electronics segment have contributed to the stock’s rise.
Is 3M a long-term buy?
3M Company (MMM) is considered a solid long-term buy due to its robust distribution network, consistent revenue growth, and strong market position in the automotive and industrial parts industry that help the business achieve double-digit returns on capital every year. Investors should keep in mind that analysts only expect 3M to see low single-digit revenue growth over the next few years.
Who owns the most MMM stock?
Vanguard owns the most shares of 3M with 49,235,598 shares worth $6.15 billion. TIKR’s Ownership tab shows all of 3M’s biggest shareholders.
Disclaimer:
Please note that the articles on TIKR are not intended to serve as investment or financial advice from TIKR or our content team, nor are they recommendations to buy or sell any stocks. We create our content based on TIKR Terminal’s investment data and analysts’ estimates. We aim to provide informative and engaging analysis to help empower individuals to make their own investment decisions. Neither TIKR nor our authors hold any positions in the stocks mentioned in this article. Thank you for reading, and happy investing!