

If you’re considering whether Coca-Cola is a good stock to buy, you’ll want to evaluate the company’s safety and quality to see if it would make a suitable long-term investment.
It’s no secret that Coca-Cola is a mature company. In fact, Coca-Cola’s revenue peaked back in 2012, and the business saw years of revenue declines. Recently, Coke was able to stabilize revenue through a series of acquisitions, making the stock safer for investors today.
When a company’s sales growth starts to slow down, it is especially important to look at the company’s financial safety and company quality.
Otherwise, debt, shrinking margins, decreasing profitability, and low company efficiency can damage a company’s once-strong core business.
That’s why this article will fully analyze Coca-Cola’s financial safety and company quality so you can see if Coca-Cola is a good stock to buy today. We’ll cover Coca-Cola’s:
- Profitability
- Earnings Quality
- Debt
- Cash Conversion Efficiency
Because these are all crucial to understanding the safety and quality of Coca-Cola’s business model.
This article is a bit on the longer side, but if you’re interested in Coca-Cola, I’d recommend reading each of the sections so you can better understand Coke’s financial position.
Or if you’re pinched for time, feel free to jump around to the sections that you’re most interested in.
How Profitable is Coca-Cola?
Profitability is a key indicator of a company’s financial health and ability to generate shareholder returns.
Investors often seek out companies with strong profitability metrics because these metrics indicate a company’s ability to outperform competitors and create value for shareholders.
Costs of sugar water (Gross Margins)
Gross margin measures the percentage of revenue left over after a company pays its cost of goods sold (COGS), which is its materials and service costs directly related to creating and delivering products or services.
For Coca-Cola, these costs include physical costs as well as labor costs to create, package, and deliver its drinks.
Gross margin is important for investors to track because it helps to show whether customers are willing to pay a premium to what it costs the business. By extension – a company with high gross margins probably has good products.
Additionally, investors can look at gross margin trends over time to see if the business has the pricing power to combat cost inflation and keep gross margins high over time.
Coca-Cola has seen high gross margins of 60.0% in the last 12 month, while gross margins have decreased over the past 5 years from 61.9% to 59.5%:
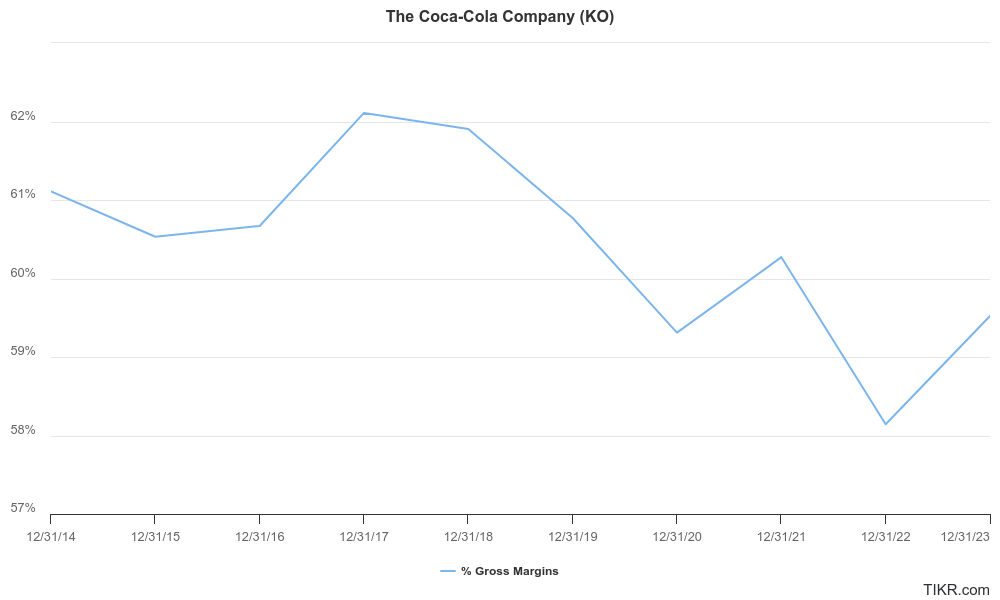
Coca-Cola has strong gross margins because we like to see companies with Gross margins over 50%.
However, Coca-Cola has only seen fair gross margin trends over the past 5 years because the company’s gross margins have fallen slightly.
Profitability after employing a small army (Operating Margins)
Coca-Cola’s main operating expense is its Selling, General & Administrative expenses.
Operating margins measure what percentage of revenue remains as operating income after a company covers its operating expenses, and it’s one of the best measures of profitability for investors to compare companies.
Coca-Cola employs over 75,000 people, so this is profitability after accounting for their salaries.
Operating margins exclude interest payments and taxes, which makes operating margins the preferred ratio to compare profitability for different companies on an “apples-to-apples” basis.
Coca-Cola’s operating margins have slightly fallen over the past 5 years, from 29.8% in 2018 to 29.1% for the most recent fiscal year:
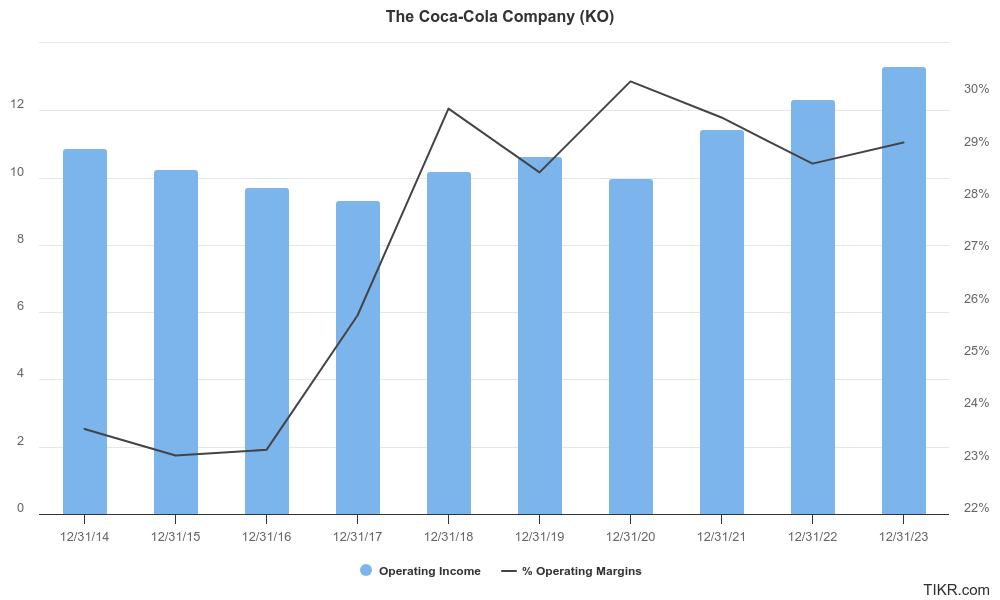
Operating margins have trended Fairly over the past 5 years because they’ve been basically flat.
Analysts expect Coca-Cola to expand its operating margins over the next 5 years:

Analysts expect Coca-Cola’s operating margins to grow at a compound annual growth rate of 2.5% over the next 5 years to 32.9%.
This is a strong sign because it means that the company is becoming more profitable as it grows and expanding its operating leverage.
Coke’s money-making machine (ROIC)
Return on invested capital is often considered the holy grail metric of profitability because ROIC measures the total return that all investors are making for their investment into the company.
The formula takes the company’s annual profit and divides by the company’s total invested capital, or Enterprise Value (Market Cap + Debt – Cash).
To give you a visual example, let’s say a company has a 15% return on capital. If you invest $100 into the business, the business machine will start to compound the value of your investment:
- Year 0: $100
- Year 1: $120
- Year 2: $144
- Year 3: $172.80
- Year 4: $207.36
- Year 5: $248.83
Return on capital measures how businesses print money and create wealth for shareholders.
Coca-Cola’s return on capital has seen strong growth over the past 5 years, rising from 15.5% to 17.8%:
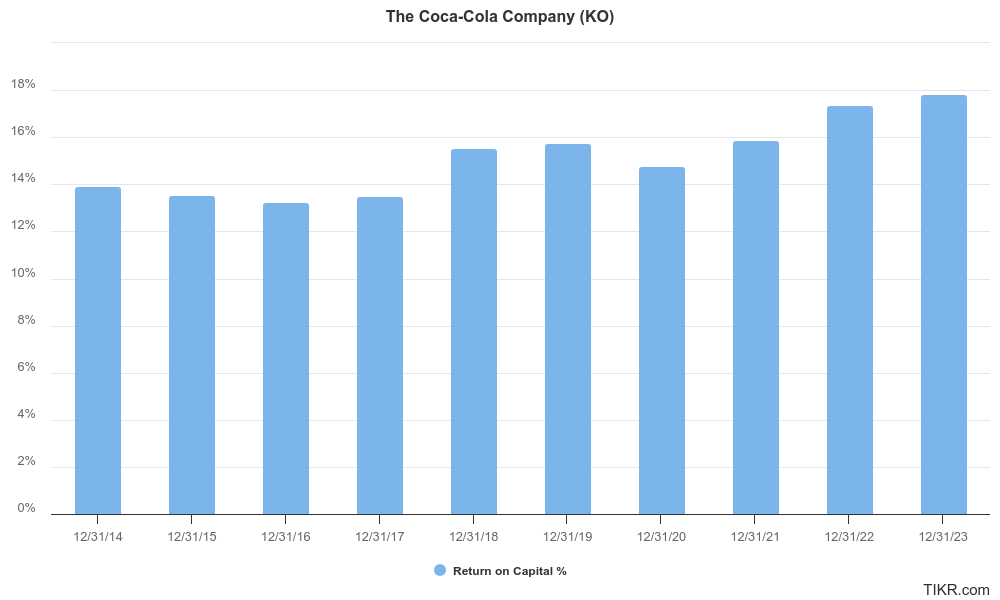
We would ideally like to see 20% returns on capital for Coca-Cola to be a really good stock to buy, but consistent, double-digit returns on capital are still impressive.
How reliable are Coca-Cola’s earnings?
Companies with high earnings quality are less likely to experience sharp profitability declines and are generally more transparent and trustworthy for investors.
This can lead to more stable stock prices and better long-term investment performance, so it’s an important measure of a company’s financial health.
How real are Coca-Cola’s earnings?
We like to see that a company’s Cash from Operations exceeds its Adjusted Net Income + Depreciation & Amortization, because this metric indicates whether the company has a good income-to-cash conversion.
It also shows how “real” the earnings are because sometimes companies will report earnings massively inflated from the actual cash the business receives.
You can see that Coca-Cola’s cash from operations (blue) is generally greater than or equal to the company’s adjusted net income (black) + depreciation & amortization (green) which shows strong cash flow efficiency:
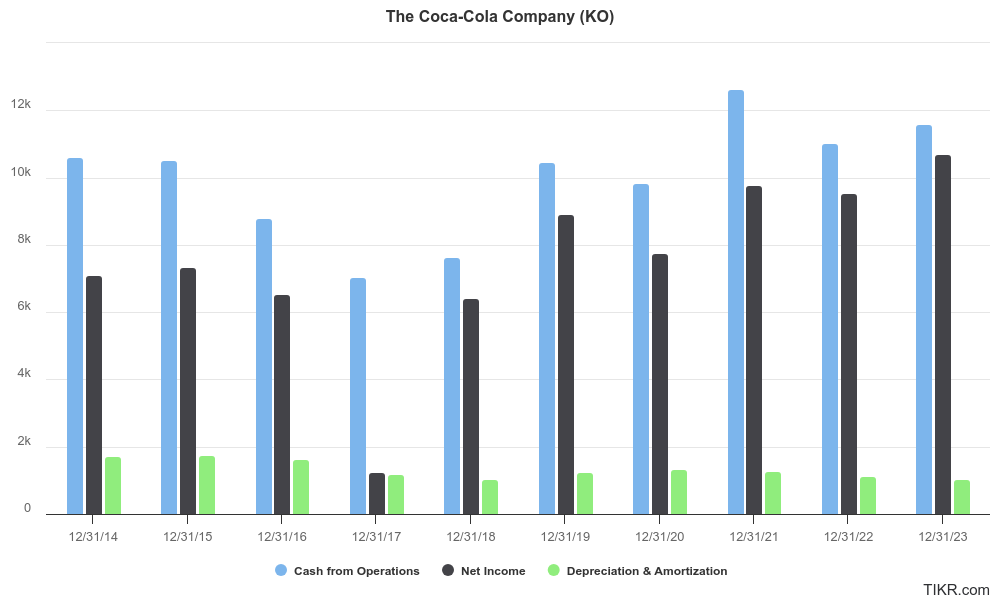
This basically means that the company has legitimate cash flow to back its earnings, so the business has a good income-to-cash conversion.
What’s Coke’s free cash flow growth rate?
A company with strong free cash flow generation can generate surplus cash, invest in growth opportunities, pay dividends, and even buy back shares. Therefore, we look for companies that have generated positive free cash flow in each of the past 3 years.
Free cash flow refers to a company’s Operating Cash Flow minus Capital Expenditures, which measures the total cash the business generates and subtracts necessary investments in property, plant, and equipment.
FCF is one of the most popular metrics for investors to track because consistent free cash flow growth is crucial for strong companies. Even though KO’s free cash flow has risen and fallen over time, FCF has grown from $8.4 billion in 2019 to $9.7 billion in 2023:
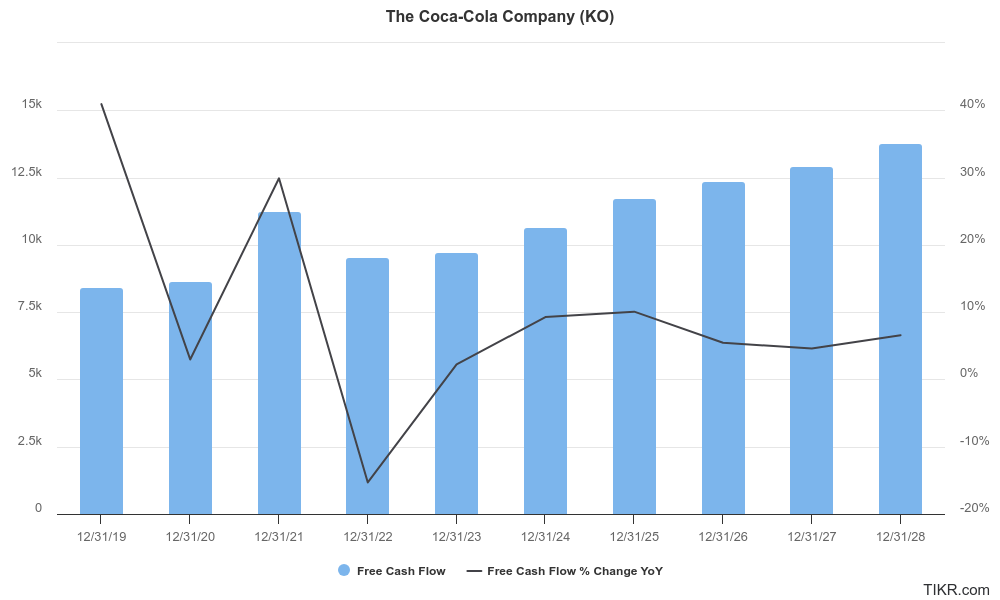
Analysts expect Coca-Cola to continue growing cash flows in the mid-single digits over the next 5 years, which means that analysts expect the company will continue growing profits as revenues grow.
Consistent free cash flow growth for companies like Coca-Cola is an important factor in finding good stocks to buy because it’s one of the primary drivers of shareholder value.
How safe is Coca-Cola’s debt?
Debt ratios are crucial for assessing a company’s financial risk.
High levels of debt can indicate potential financial instability, especially if the company faces a downturn or rising interest rates. Conversely, low debt levels may suggest that a company is stronger and can withstand economic downturns.
Assessing debt ratios for mature businesses like Coca-Cola is especially important because it helps ensure the company’s strong cash flows and low risks of default or financial insolvency.
Net Debt/EBITDA
This ratio measures a company’s ability to pay off its net debt (total debt minus cash) with its earnings before interest, taxes, depreciation, and amortization (EBITDA). It’s simply net debt divided by EBITDA.
This ratio is a key indicator of a company’s financial health and leverage. It’s better to see a low Net Debt/EBITDA ratio because this suggests that a company is less reliant on debt to finance its operations.
Over the past 10 years, Coca-Cola’s Net Debt/EBITDA ratio has fluctuated somewhere between 1.5x and 3.5x, which is healthy and reasonable:
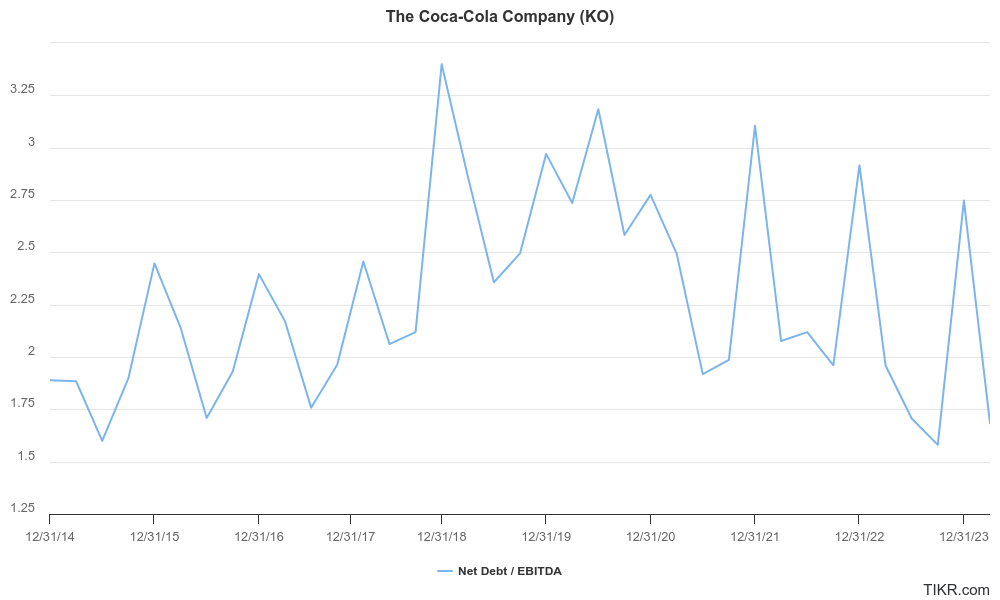
Currently, Coca-Cola has a fair Net Debt/EBITDA of about 1.96x, which is healthy and reasonable.
Can Coke easily cover its interest payments?
The Interest Coverage ratio measures how easily a company can pay interest on its outstanding debt. It’s calculated by dividing earnings before interest and taxes (EBIT) by the company’s interest expense.
It’s better to see a higher interest coverage ratio because this indicates that the company generates enough earnings to cover its interest payments comfortably.
Meanwhile, a low interest coverage ratio can be a red flag because it indicates that the company might have difficulties meeting its interest obligations.
Over the last 12 months, Coca-Cola has seen a strong interest coverage ratio of 8.7x:
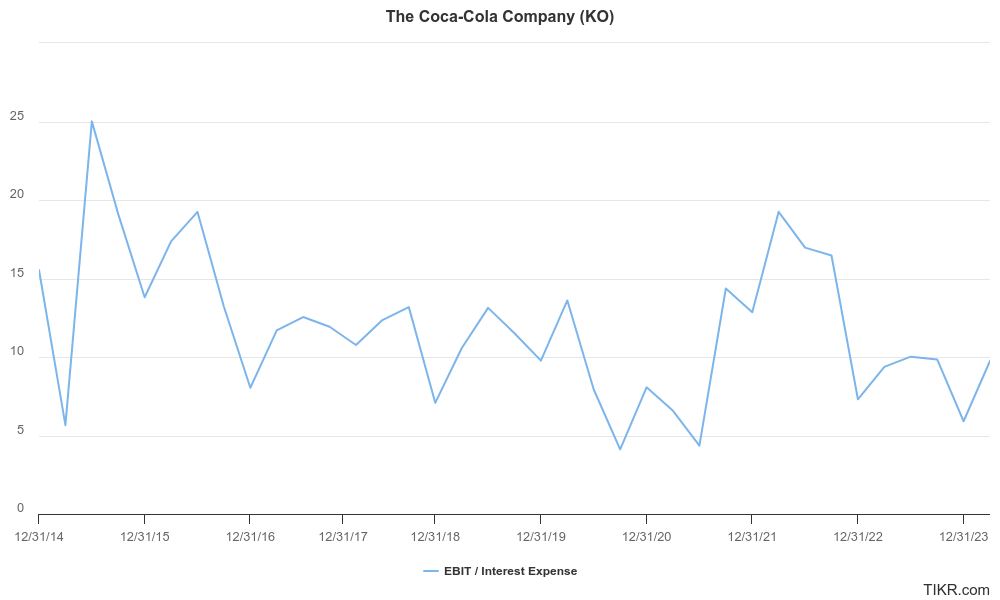
We like to see companies with interest coverage ratios of over 3x, so Coca-Cola passes this test with flying colors.
How efficient is Coca-Cola’s business?
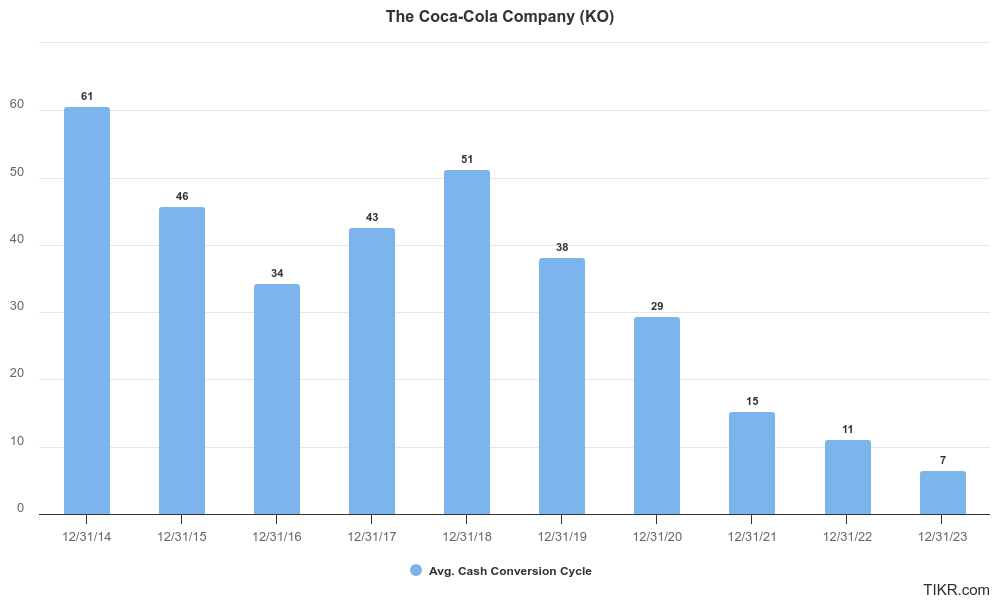
One easy way to measure whether a company is becoming more efficient over time is to examine its cash conversion cycle.
The Cash Conversion Cycle (CCC) measures how quickly the company can receive cash after creating its products and how slowly it pays out cash for its expenses. It is calculated by combining three key components:
- Days Sales Outstanding (DSO): Measures the average number of days a company takes to collect cash after selling something.
- Days Inventory Outstanding (DIO): Measures the average number of days a company takes to sell its inventory.
- Days Payable Outstanding (DPO): Measures the average number of days a company takes to pay its suppliers.
The formula for CCC is:
CCC = DSO + DIO − DPO
The lower the Cash Conversion Cycle – the better.
The Cash Conversion Cycle is important for companies that buy and sell physical inventory, like Coca-Cola.
Companies with low CCCs get paid quickly, which means they hold as little inventory as possible and receive cash from sales quickly.
Additionally, companies with low CCCs tend to have agreements with their suppliers to pay them out later. All in all, they collect cash fast and pay cash out slowly.
Coca-Cola’s cash conversion cycle has improved dramatically in the past 3 years from 29 days to just 7 days, driven by small improvements in each of the 3 CCC components:
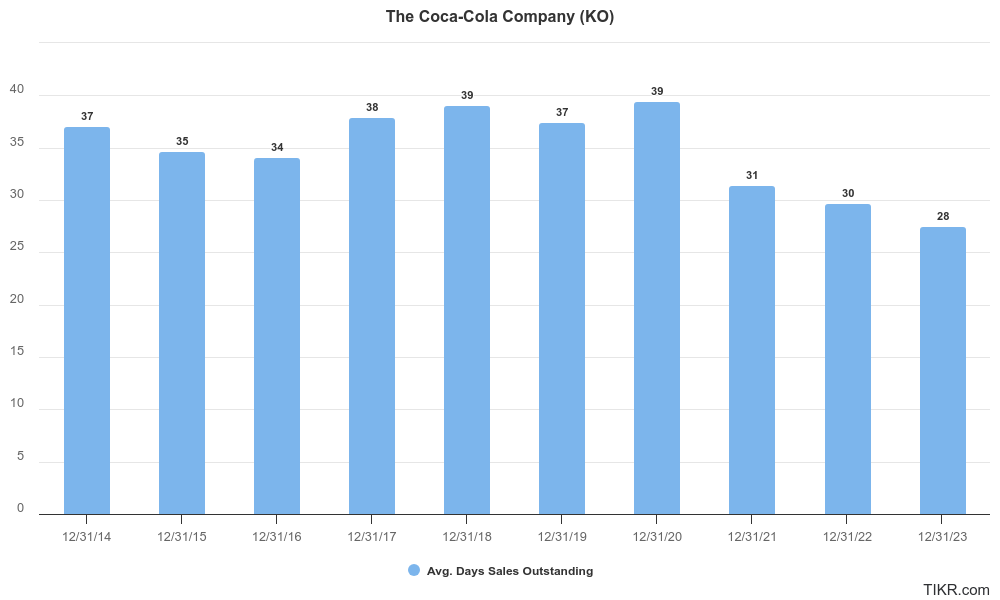
How quickly does Coca-Cola get paid by customers?
Days Sales Outstanding (DSO) measures the average number of days a company takes to collect payment after a sale. It is calculated by dividing accounts receivable by total sales, multiplied by the number of days in the period (typically 365 for 365 days in a year).
Investors prefer to see companies with a lower DSO, which means that the company collects payments quickly, improving cash flow and reducing the risk of bad debts.
Conversely, companies with consistently high DSO might have issues with cash flow management or potential problems with customer creditworthiness.
Over the past 3 years, Coca-Cola has been able to reduce its DSO from 39 to 28, indicating that the company is seeing its accounts receivable turn into cash quicker:
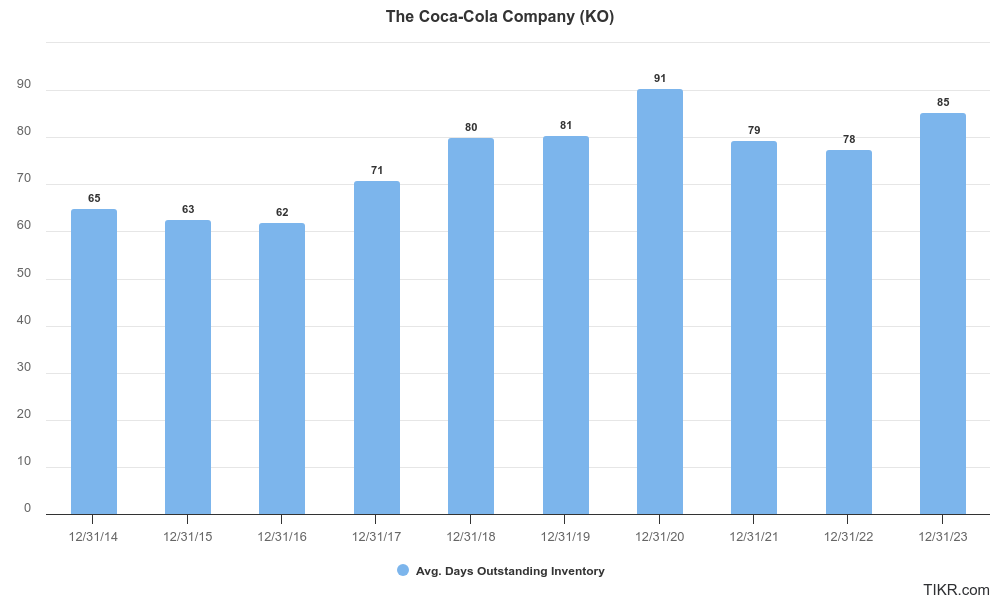
How long does Coca-Cola hold onto inventory?
Days Inventory Outstanding (DIO) is a key measure of inventory management efficiency because it measures the average number of days it takes a company to sell its inventory.
It is calculated by dividing inventory by cost of goods sold (COGS), and multiplying by the number of days in the period (typically 365).
A lower DIO is good because it indicates that a company can sell its inventory quickly, which can reduce storage costs and minimize the risk of inventory going obsolete.
Efficient inventory management can lead to better cash flow and higher profitability, which makes DIO an important metric for investors to be aware of.
Over the past 3 years, Coca-Cola has been able to reduce its DIO from 91 days to 85 days, which means that the company became more efficient by selling inventory quickly:
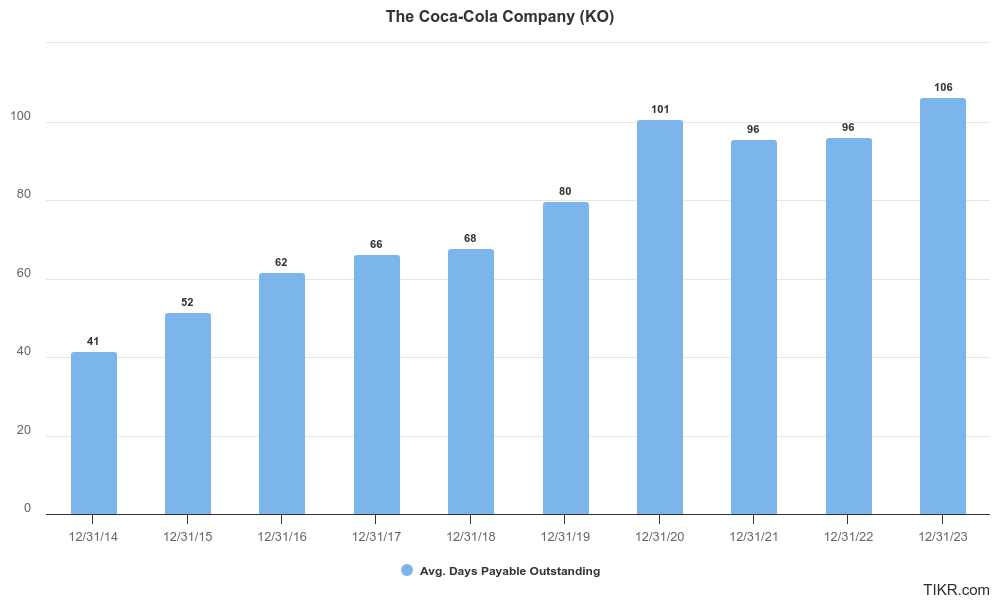
How long can Coca-Cola wait to pay its suppliers?
Days Payable Outstanding (DPO) measures the average days a company takes to pay its suppliers after receiving inventory or services.
It is calculated by dividing accounts payable by cost of goods sold (COGS), and multiplying by the number of days in the period (usually 365).
A higher DPO is better because that means the company takes longer to pay its suppliers, which frees up cash that the company can use.
Over the past 3 years, Coca-Cola’s DPO improved slightly from 101 to 106, which shows the company was able to negotiate better terms with its suppliers:
Final Thoughts:
Coca-Cola is a mature business, so it’s especially important to evaluate Coke’s financial safety and company quality to see if it would make a suitable long-term investment.
Coca-Cola has strong quality, driven by strong gross and operating margins and fair returns on capital.
KO has strong financial safety with earnings adequately backed by cash flows, good debt ratios, and strong cash conversion efficiency with a Cash Conversion Cycle that’s improved in recent years.
Coca-Cola is a high quality business that’s financially safe to invest in, which means it could be a good stock to buy at the right price.
Check out Coca-Cola’s Analyst Estimates to get a full look at where Wall Street’s analysts think the company’s going and Coca-Cola’s Valuation to see if the stock is appropriately priced.
Coca-Cola Stock FAQs:
Is Coca-Cola a safe stock?
Coca-Cola (KO) remains a stable investment due to its strong brand, consistent dividend payouts, and global market presence. However, potential investors should consider the current valuation and economic conditions, as these factors might affect short-term performance. Additionally, evaluating whether KO aligns with your long-term investment goals and risk tolerance is essential.
Is Coca-Cola a good stock to buy right now?
The future of Coca-Cola (KO) stock appears promising due to its robust global brand, diversified product portfolio, and strong dividend history. Coca-Cola is a high-quality business with dependable financial safety. However, growth may be moderate as the company faces challenges like changing consumer preferences and economic uncertainties. Long-term investors should weigh these factors and consider their investment objectives.
Is Coca-Cola a good dividend stock?
Coca-Cola currently has a 2.8% dividend yield, which is a bit lower than its 5-year average. Although the company does have a high 74% payout ratio, Coca-Cola’s track record of 52 consecutive years of dividend increases paired with analysts’ estimates for low single-digit annual dividend increases over the next 5 years make Coca-Cola a good dividend stock for investors, if they buy the stock at a good price. Of course, this is not investment advice.
Is KO a long-term buy?
Coca-Cola (KO) is considered a solid long-term buy due to its strong brand, consistent dividend payouts, and global market presence. Its diversified product portfolio and strategic adaptations to changing consumer preferences support sustained growth. However, investors should monitor economic conditions and market competition.
Who are some of Coca Cola’s biggest shareholders?
You can see some of Coca-Cola’s biggest shareholders through TIKR’s Ownership tab.
Disclaimer:
Please note that the articles on TIKR are not intended to serve as investment or financial advice from TIKR or our content team, nor are they recommendations to buy or sell any stocks. We create our content based on TIKR Terminal’s investment data and analysts’ estimates. We aim to provide informative and engaging analysis to help empower individuals to make their own investment decisions. Neither TIKR nor our authors hold any positions in the stocks mentioned in this article. Thank you for reading, and happy investing!