
Some businesses invest their shareholders’ capital wisely, turning every dollar into significantly more profit. These companies create long-term value and drive strong stock performance for investors.
But other companies waste capital through unprofitable expansion or poor decisions. These companies see poor returns, weak profitability, and they’ll ultimately see poor stock performance over the long term.
Investors can analyze the quality of a business by looking at a company’s Return on Invested Capital (ROIC). By understanding ROIC, you can identify businesses that use their resources efficiently and create long-term shareholder value.
This article will break down how to measure ROIC, what it reveals about a company, and how you can use it to make smarter investment decisions.
What Is Return on Invested Capital (ROIC)?
Return on invested capital (ROIC) is a metric investors use to determine how efficiently a company allocates its capital to generate profits. A high ROIC shows the company is investing its capital in profitable projects.
ROIC is often expressed as a percentage. For instance, a 50% ROIC tells you that for every dollar invested in a company, it would generate 50 cents in income. Some investors go for companies with a consistently high ROIC, as it’s a good sign of business performance.
Pro Tip: As a rule of thumb, wonderful companies tend to consistently average over 20% returns on capital. Companies that consistently see less than 10% returns on capital might struggle to create shareholder value over the long term.
Savvy investors compare ROIC to the weighted average cost of capital (WACC) to determine if a company uses its capital effectively.
Evaluate Return on Invested Capital (ROIC) faster with TIKR >>>
ROIC vs WACC
ROIC measures how efficiently a company generates profits from the capital invested in its operations. It is a key indicator of a company’s ability to generate returns for its shareholders.
On the other hand, Weighted Average Cost of Capital (WACC) represents the average cost of financing a company’s operations through debt and equity. It considers the cost of both debt and equity capital and is used to discount future cash flows in valuation models.
For a company to create value for its shareholders and be financially healthy, its ROIC should be higher than its WACC. If ROIC is greater than WACC, the company earns more from its investments than it pays in financing costs to fund those investments. This means it’s generating excess returns for its investors and shareholders, which is positive for the company’s value. Conversely, if ROIC is lower than WACC, the company’s investments are not generating enough returns to cover the cost of capital, indicating a potential loss of value and financial inefficiency.
How To Calculate ROIC
To calculate ROIC, divide Net Operating Profit After Taxes (NOPAT) by invested capital. It’s usually expressed as a percentage.

- NOPAT: measures the company’s earnings assuming it has no debt. So, whether a company is financed with all equity or has debt, NOPAT is calculated to be the same. To calculate NOPAT, subtract cash taxes from Operating Income or Earnings Before Interest and Taxes (EBIT).
- Invested Capital: Refers to the total amount of capital invested in a company, both from debt and equity sources. Invested capital is the sum of long-term debt, short-term debt, and equity.
Pro tip: TIKR.com offers detailed financial data including ratios like Return on Invested Capital on 100,000+ stocks globally.
Find the best stocks to buy today with TIKR >>>
What Is a Good Return on Invested Capital Ratio?
One useful benchmark is that a good return on invested capital generally exceeds the company’s WACC by at least 2%. A higher ROIC than WACC is a positive sign, showing the company is using its money wisely and creating value for its investors.
Generally, the higher the ROIC, the better, as it indicates the company is more efficient at making money from its resources. For example, O’Reilly Automotive (ORLY) has an ROIC of 50% versus its peer, Advance Auto Parts (AAP), which has an ROIC of 2%.
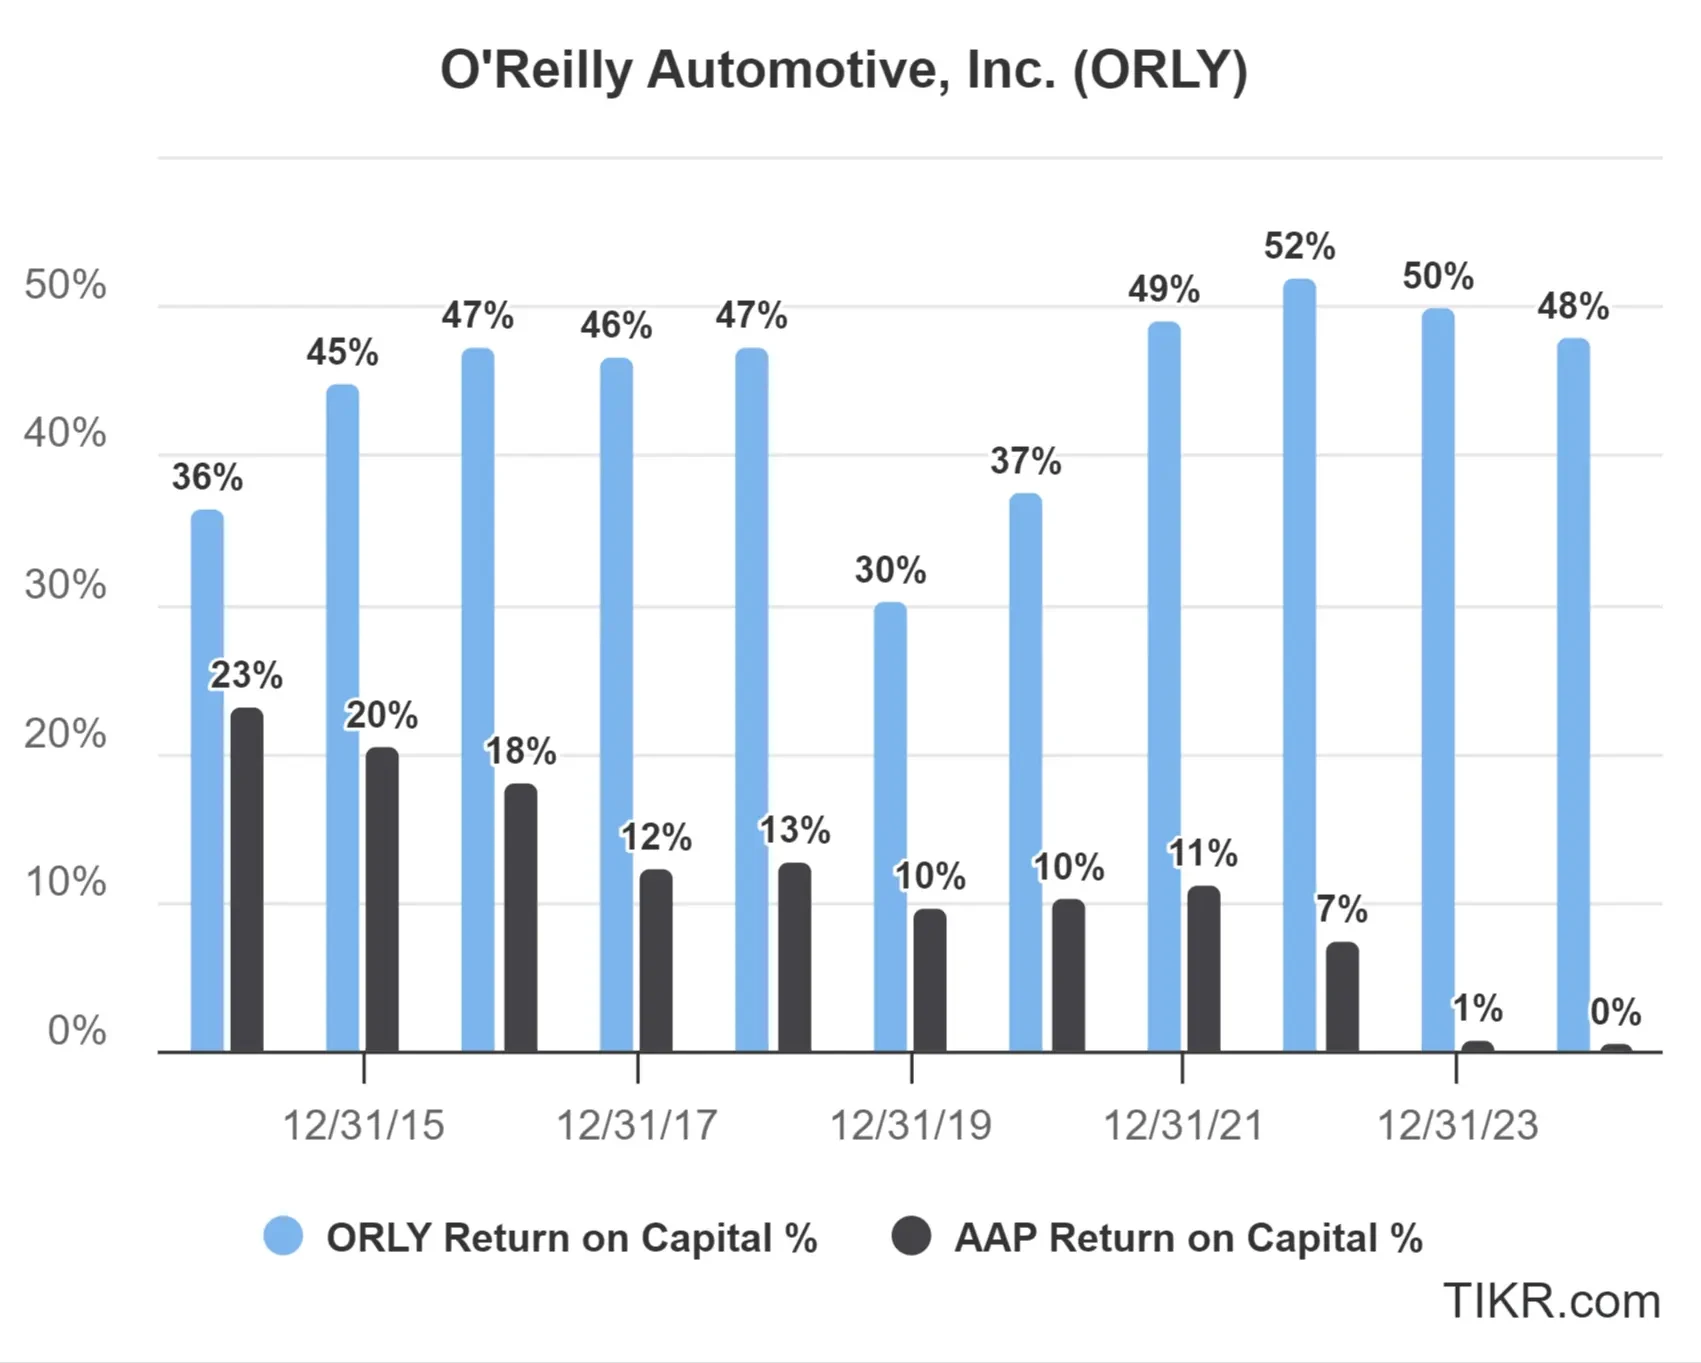
It’s important to understand the drivers of the ROIC difference here, but with all else equal, this shows that O’Reilly is the more efficient business.
Companies with Strong ROIC
Companies with high ROIC know how to invest their money wisely. They turn every dollar of capital into strong profits, which fuels long-term growth.
These businesses often have competitive advantages, strong pricing power, and efficient operations.
Here are a few examples:
- Texas Instruments (TXN) focuses on high-margin semiconductor products while keeping capital expenditures low, resulting in an ROIC averaging over 30% annually. Its disciplined approach to R&D and manufacturing makes it one of the most efficient chipmakers.
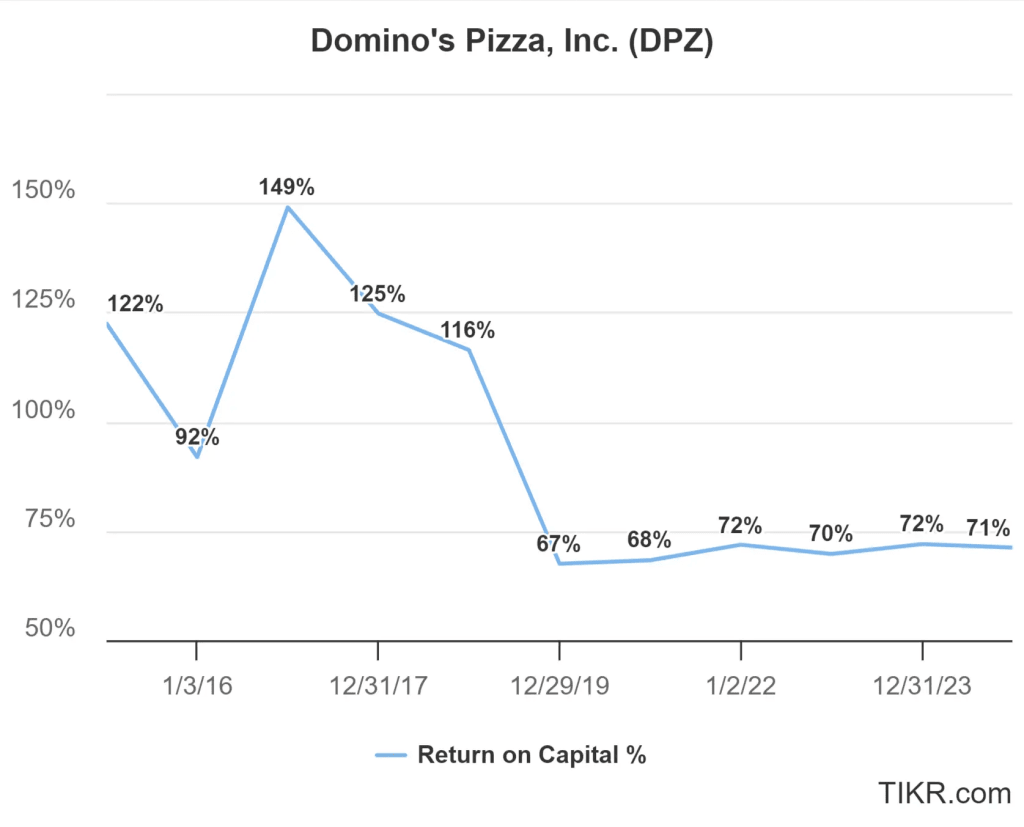
- Domino’s Pizza (DPZ) has built an efficient franchise model that requires little capital while delivering strong profits. Its ROIC currently exceeds 70%, which shows how well it’s been able to scale profits without heavy reinvestment.
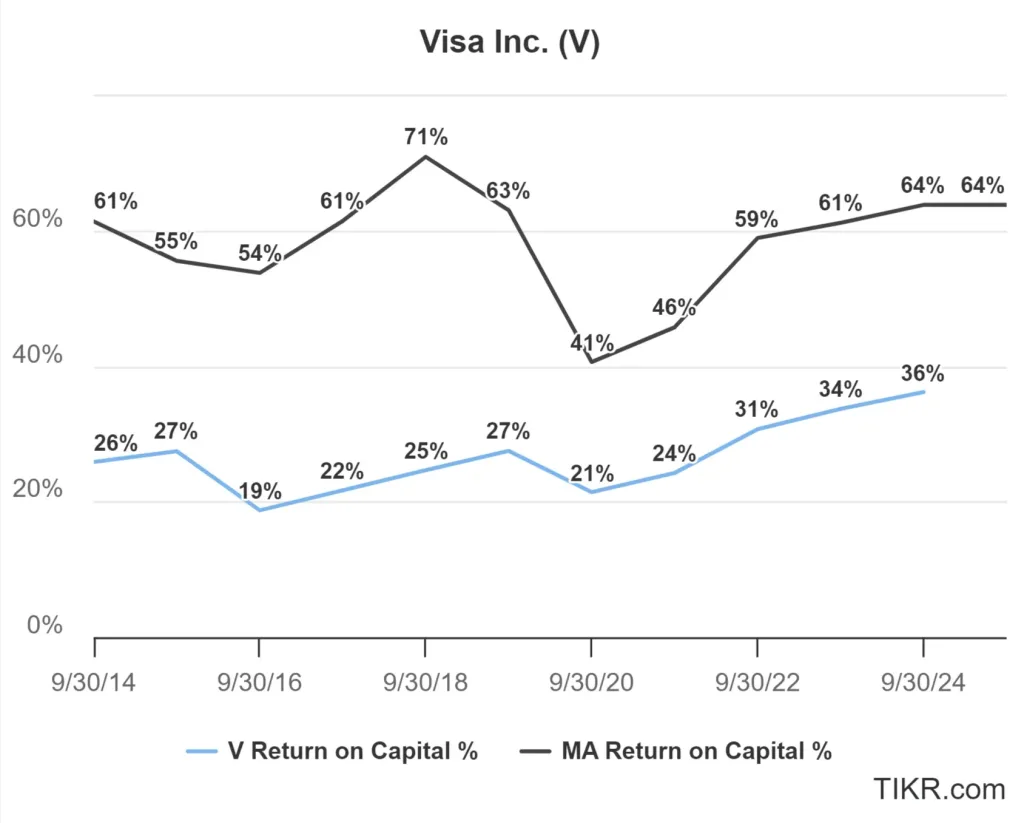
- Visa (V) & Mastercard (MA) run asset-light businesses with high operating leverage, allowing them to generate ROIC well above 20% with minimal capital needs.
- MSCI (MSCI) operates a high-margin data and credit rating businesses that requires very little reinvestment. Their strong ROIC reflects how efficiently they earn strong profits on the capital invested in the business.
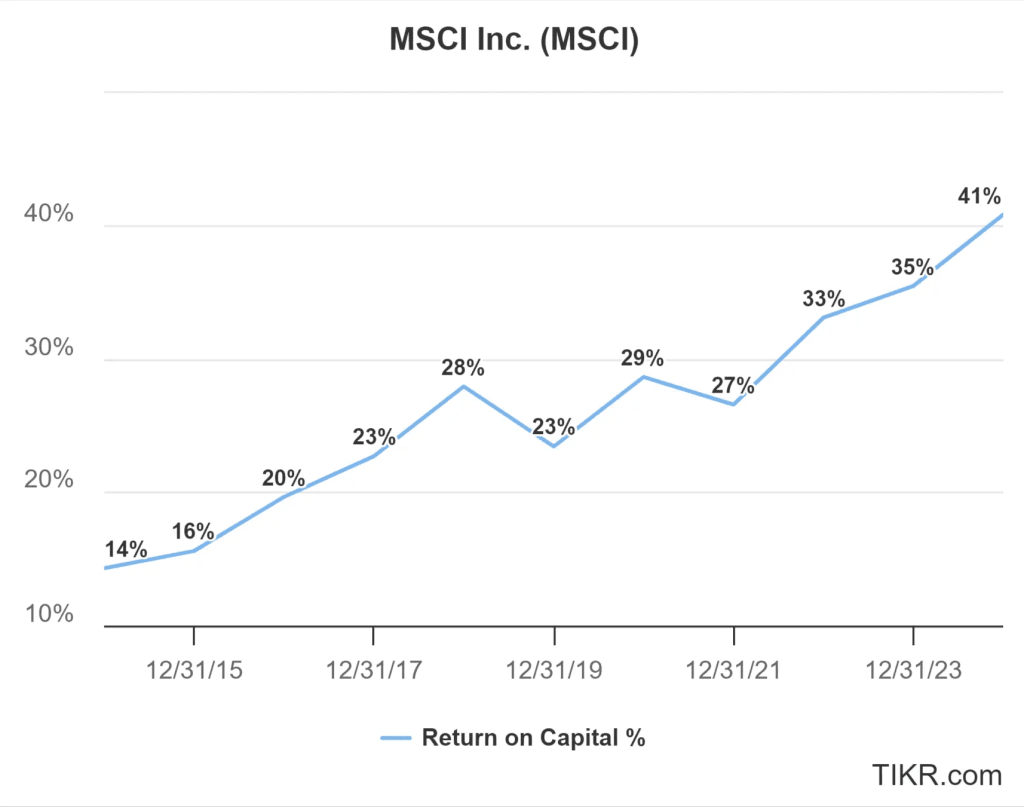
When a company consistently posts high ROIC, it signals that it can use its capital efficiently. These businesses can reinvest in growth without sacrificing profitability, leading to compounding returns for investors.
Companies with Weak ROIC
Companies with low ROIC struggle to turn generate strong profits from their investments.
Some expand too aggressively, while others waste capital on projects that fail to deliver returns.
Here are some businesses that face ROIC challenges:
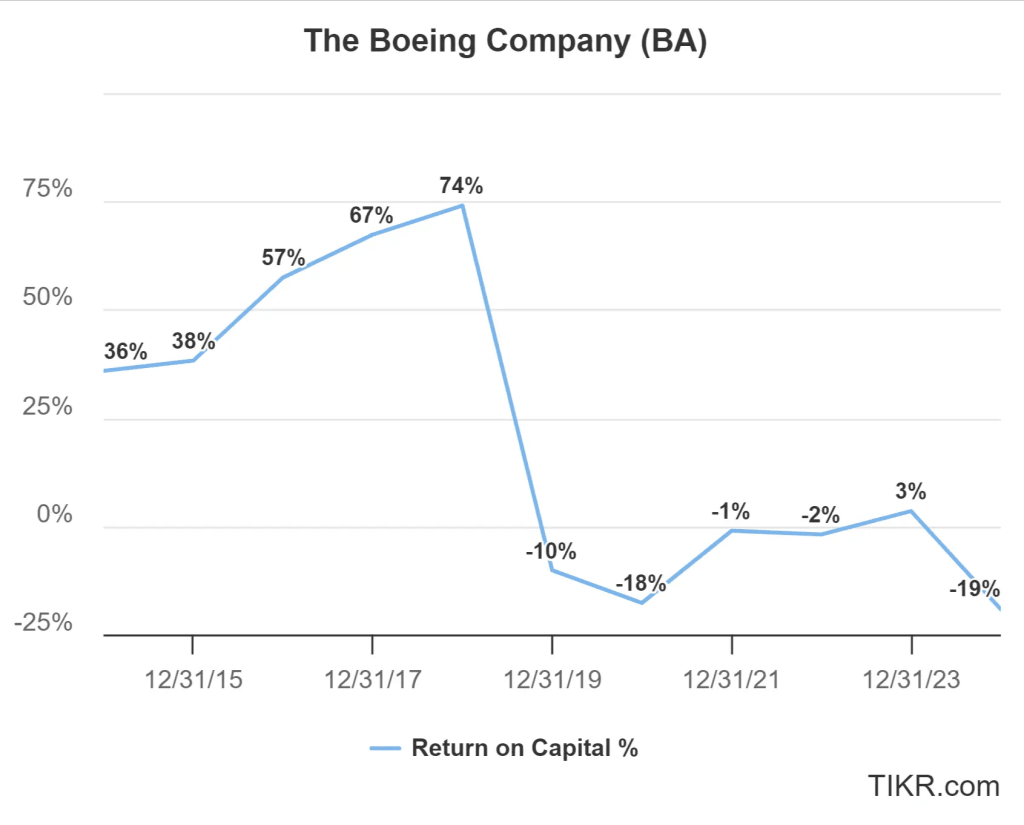
- Boeing (BA) has suffered from production delays, quality issues, and rising costs. Its low ROIC reflects the difficulty of turning its massive capital base into steady profits.
- Walgreens Boots Alliance (WBA) operates in a highly competitive retail pharmacy market with pricing pressure and rising costs. Its ROIC has struggled as the company struggles to generate strong profits.
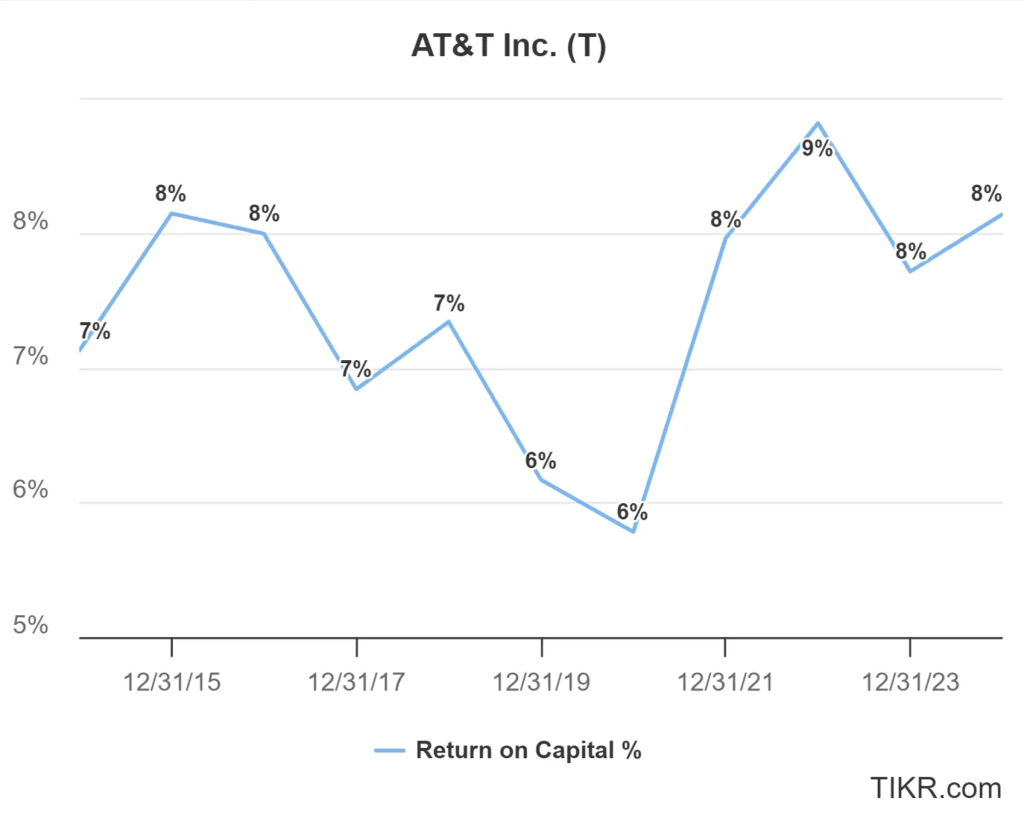
- AT&T (T) carries heavy debt and spends billions on infrastructure, but its low ROIC shows these investments generate low economic profit.
- Lucid Motors (LCID) & Other Startups often see low or negative ROIC because these businesses are on the path to profitability. Additionally, these businesses tend to invest heavily in growth, which reduces NOPAT (net operating profit after tax), which is the “return” piece in return on invested capital.
A low ROIC isn’t always a dealbreaker for a company because many companies seeing low ROIC might be on the path to profitability or reinvesting for growth.
However, when a business consistently fails to generate strong returns, it’s a warning sign that it might not create long-term value for investors.
Limitations of ROIC
ROIC is a valuable financial metric, but it has certain limitations that should be taken into account.
One-time items can distort ROIC. For example, NOPAT in the numerator can be distorted by restructuring charges, write-offs, litigation, and other one-time charges. It’s important that the inputs to ROIC are a reliable measure of the business’s ongoing operations.
ROIC is also less applicable in some sectors than others. For example, using ROIC to evaluate banks isn’t viable because banks use financing for their products (e.g. loans). In this case, Return on Equity (ROE) would be a better metric to evaluate banks.
Finally, young companies may be unprofitable because they are reinvesting profits into the business to grow. If this is the case, ROIC won’t be as helpful for measuring the company’s early profitability.
Understand the Limitations of ROIC instantly with TIKR >>>
Other Profitability Metrics
While ROIC is a powerful metric, it’s not the only way to measure a company’s profitability and efficiency. Investors often look at Return on Equity (ROE) and Return on Assets (ROA) alongside ROIC to get a fuller picture.
- Return on Equity (ROE): ROE measures how effectively a company uses shareholders’ equity to generate profits. It’s calculated as Net Income / Shareholder Equity. A high ROE suggests a company is efficiently generating returns for shareholders. However, excessive debt can artificially inflate ROE (high debt decreases shareholders’ equity), which is something to be mindful of.
- Return on Assets (ROA): ROA evaluates how well a company uses its assets to produce profit. It’s calculated as Net Income / Total Assets. A high ROA indicates a company efficiently uses its assets to generate earnings, but capital-intensive industries often have lower ROAs due to large asset bases.
Each metric provides a different angle on profitability, but ROIC is widely accepted as the best metric because it measures the total profit the company creates on its total invested capital. This is the best way to measure the company’s ability to create value for shareholders.
FAQ Section:
What is Return on Invested Capital (ROIC)?
Return on Invested Capital (ROIC) measures how efficiently a company generates profits from its invested capital. It helps investors determine how well a company is using its capital to create value.
How is ROIC calculated?
ROIC is calculated by dividing a company’s net operating profit after taxes (NOPAT) by its invested capital. This ratio provides insight into the company’s ability to generate returns relative to its capital base.
What is considered a good ROIC?
A good ROIC typically exceeds the company’s weighted average cost of capital (WACC), indicating that the company is generating returns above its cost of financing. Generally, an ROIC above 10% is viewed positively, though this varies by industry.
Why is ROIC important for investors?
ROIC helps investors assess a company’s profitability and efficiency in deploying capital. A high and consistent ROIC suggests strong management and sustainable competitive advantages.
How does ROIC compare to other profitability metrics?
ROIC is more comprehensive than metrics like return on equity (ROE) or return on assets (ROA) because it accounts for both debt and equity financing. This makes it a useful tool for evaluating a company’s true financial performance.
TIKR Takeaway
ROIC tells you how well a company uses its money to generate profits. A high ROIC shows that a company is making good use of its resources by investing in profitable projects and investments.
If a company’s ROIC exceeds its cost of capital, this can drive big gains in a company’s stock price over time because the business is creating value for shareholders.
The TIKR Terminal offers industry-leading financial information on over 100,000 stocks, helping you find the fastest-growing stocks today.
TIKR offers institutional-quality research with a simple platform made for individual investors like you.
Disclaimer:
Please note that the articles on TIKR are not intended to serve as investment or financial advice from TIKR or our content team, nor are they recommendations to buy or sell any stocks. We create our content based on TIKR Terminal’s investment data and analysts’ estimates. We aim to provide informative and engaging analysis to help empower individuals to make their own investment decisions. TIKR doesn’t hold positions in any of the stocks mentioned in this article. Thank you for reading, and happy investing!